Leading With Scale Through Impact Metrics
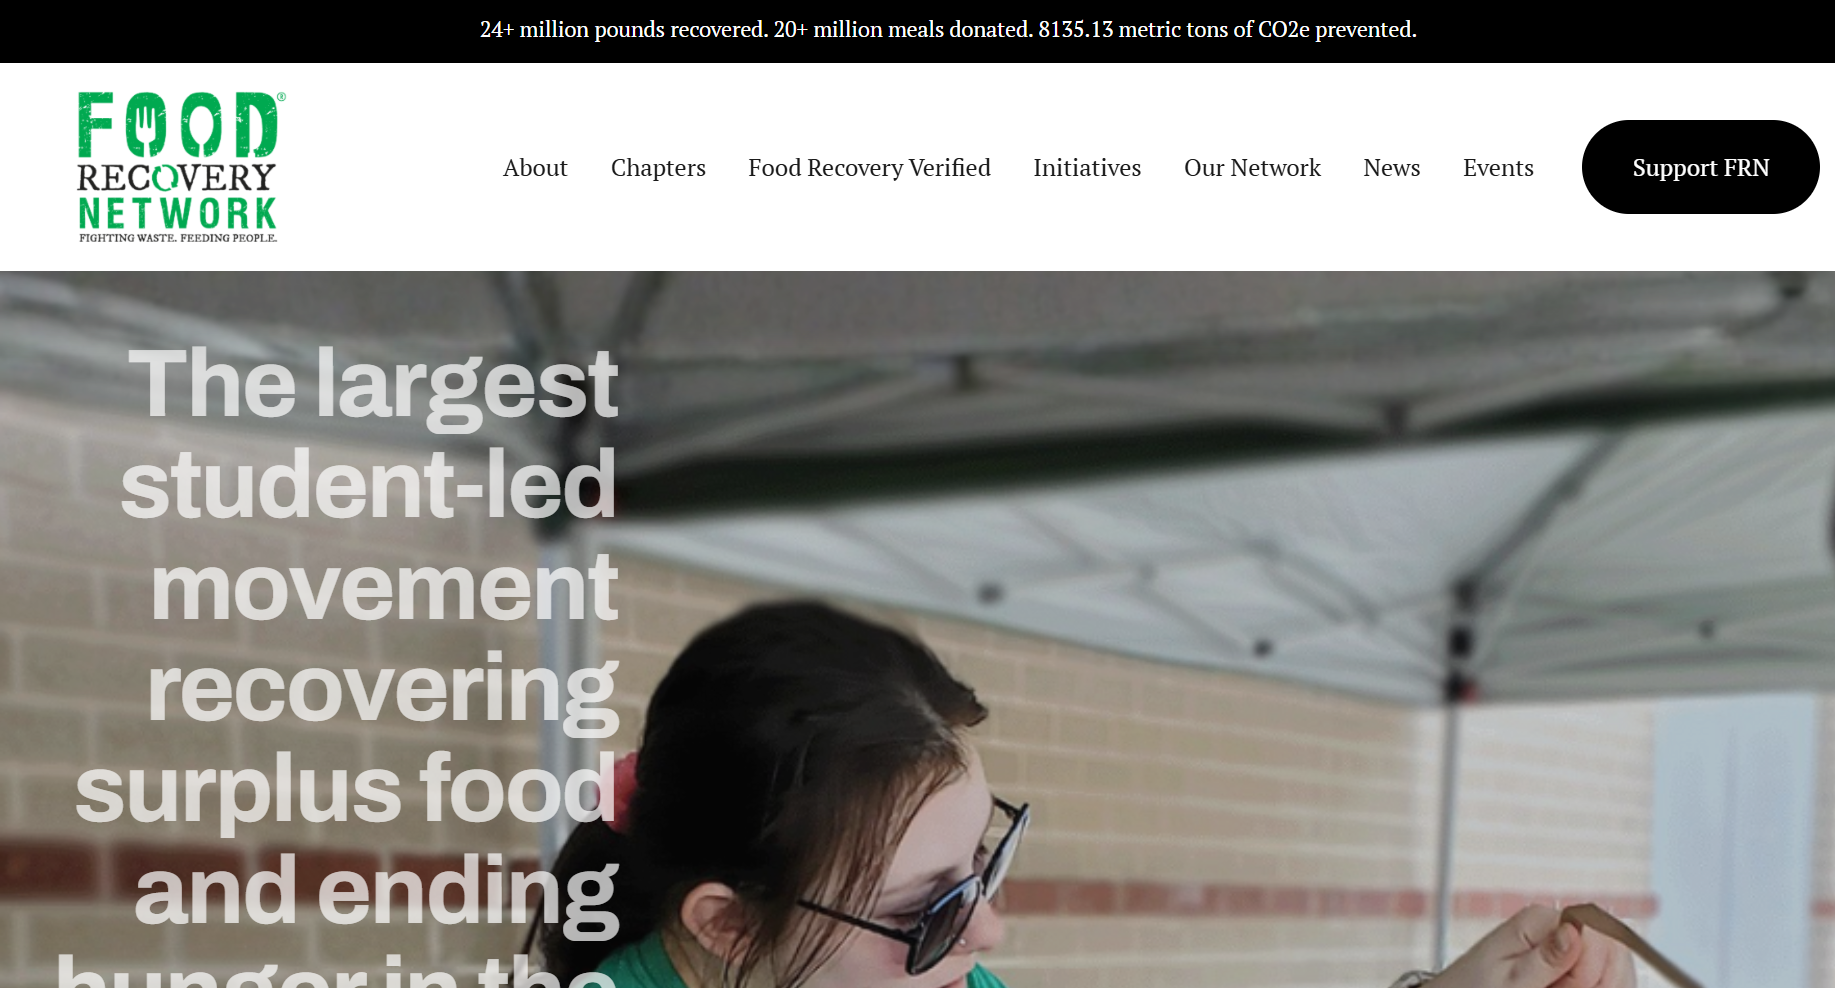
Food Recovery Network homepage banner showing cumulative impact metrics, March 2026
Food Recovery Network, March 2026
Interface: Homepage messaging
Lens: Explain the Work
Pattern: Scale-First Impact Framing
Issue Area: Hunger
Key Signal
A homepage banner presents cumulative impact metrics at the top of the page.
The figures appear before any narrative description of the work.
Why It Matters
Leading with quantified impact establishes scale before explanation.
Observation: A banner at the top of the Food Recovery Network homepage highlights cumulative impact metrics including pounds of food recovered, meals donated, and emissions prevented. These figures appear before any narrative description of the organization’s work.
Why It Matters: Visitors encounter evidence of impact immediately, before reading about programs, history, or stories from the field.
Why This Works
Anchors first impressions in measurable outcomes
Signals credibility through aggregated data
Reduces reliance on narrative to convey impact
Frames the organization as operating at scale
Creates immediate context for interpreting the rest of the site
What I’m Watching: How often nonprofits introduce their work through cumulative metrics and whether this framing shapes visitors’ first impressions of credibility and scale.